Data Science Question
Today i read post in quora about 20 question to detect fake data science. This is my answer about this questions if don’t know then i will note that i don’t know the answer.
What is the P-value and is it different from type I error.
=> what i know P-values is technic to observed sample results to test our statistical hypotesis. And Type i error is incorrect of null hypothesis (“false positive”)What are the metrics to evaluate a search engine website?
=> i have hear it on coursera course about page rank. But i’m not sure yet about the method and i will update the answer later.Three ants are sitting at the three corners of an equilateral triangle. Each ant starts randomly picks a direction and starts to move along the edge of the triangle. The probability that none of the ants collide = [ ? / ? ]
Follow-up: k ants are sitting at the k corners of an equilateral polygon. Each ant starts randomly picks a direction and starts to move along the edge of the triangle. The probability that none of the ants collide = [ ? / ? ]
=> P(N) = P(CW) + P(ACW) = 0.5 * 0.5 * 0.5 + 0.5 * 0.5 * 0.5 = 0.25
why 0,5 because probability to go to cw and anti cw is 50 - 50 which is 0,5. Why its three times 0.5 ? because there is three ants.
Given a Table with dateid, adid, impressions, partitioned by dateid, we need to calculate the total impression for an adid in last 28d days. The challenge here being that each partitions has close to 4 Billion rows and we want to avoid scanning 28 partitions every day. How will you optimize it so you don’t have to scan 28 partitions every day.
=> the query i think will be select adid, sum(impressions) from table group by adid where datediff(‘days’, current_date, dateid) >= 28
note : i’m using postgres and i’m not compiling it maybe will be syntax error. And the data is about 4 billion rows and we are doing it maybe take much times. So the solution i think will be caching the total impression in every day so we just need to calculate the sum of the data.Return all country, date, and sales_amt where sales_amt >= 8
=> select * from interview_sales where sales_amt >= 8
- Return total sales_amt per country => select country, sum(sales_amt) from interview_sales group by country
-Return total sales_amt per country and day where the total sales_amt >= 10
=> select country, sum(sales_amt)as total from interview_sales group by country having total >= 10
- Coupon Collector There are 100 balls with #1 - #100 mark on each of them. Randomly choose one ball, and marked it with star. (without knowing the # on it.) Repeat this process for 100 times. If the balled picked already got star on it, put it back. And start the next process.
- After repeat this process for 100 times, get the ball with #1, what’s the probability that it’s not been marked with star?
- What’s the number of times that you need to repeat this process if you want to get all the balls marked? =>
Trailing Zeros
Count how many trailing 0 in (100!)
=> product of that have 0 in back (10, 20, 30 .. ) of the number will come from 5. So it will be 100 : 5 = 20 (5, 10, 15, 20, 25) but there will be 25 ( 5 x 5) so we will count 100 / 25 = 4. And check 25 * 5 is < 100 yeay false. So the count of trailing zeros in 100 is 24Estimate Daily Number Of Fries Sold At McDonalds
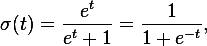
=> i’m not sure about the answer but the answer will be num of order * price of fries * average of fries every pack.Logistic Regression
=> it can see in wikipedia about logistic function here :
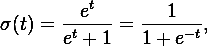
Linear Regression
How do you diagnose your how your linear regression model fits the data?
=> Means Square Error. by meausure distance error of our hypotesa to actual data.
note: maybe there is some error and blank in my question and i will update it when i have some time. And also i’m not a data scientist and my answer is just from my experience